Real-Time Analytics for Events in Saudi Arabia
Live intelligence across every zone — so you can act on data, not assumptions.
0
Live metrics
Updated per scan
0
Dashboard latency
0
Event visibility
0
Export formats
Why This Matters
Event operations teams are often flying blind — they know how many people registered, but not how many are currently in each zone, which areas are approaching capacity, or where accreditation bottlenecks are forming. By the time a problem is visible, it has already become a crisis.
Stamp IQ streams live scan data into operations dashboards accessible from any device. Occupancy by zone, registration status breakdowns, approval queue depths, and anomaly alerts are all surfaced in real time. Post-event, a comprehensive analytics report is generated automatically with insights for your next event.
50+
Live metrics
Updated per scan
<100ms
Dashboard latency
360°
Event visibility
PDF/XLS
Export formats
How It Works
A structured four-step delivery process for real-time analytics
Dashboard Configuration
We configure your operations dashboard with the metrics your team needs most, laid out for fast comprehension under pressure.
Alert Thresholds
Capacity warnings, approval queue thresholds, and anomaly detection rules are set before the event goes live.
Live Operations
Real-time data flows from all scanners into your dashboard. Your ops team monitors, responds, and adjusts in real time.
Post-Event Report
A full analytics report — registrations, approvals, zone utilisation, dwell times, anomalies — is generated automatically within hours.
Key Features
Every capability that makes our real-time analytics service the most complete in the market
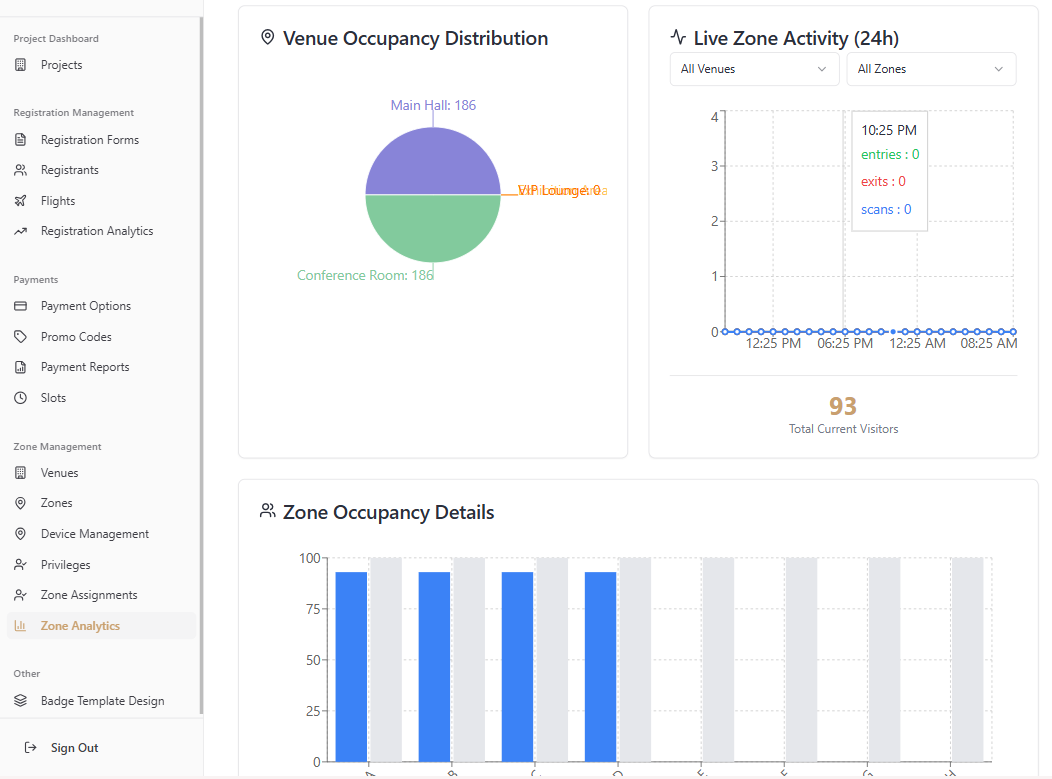
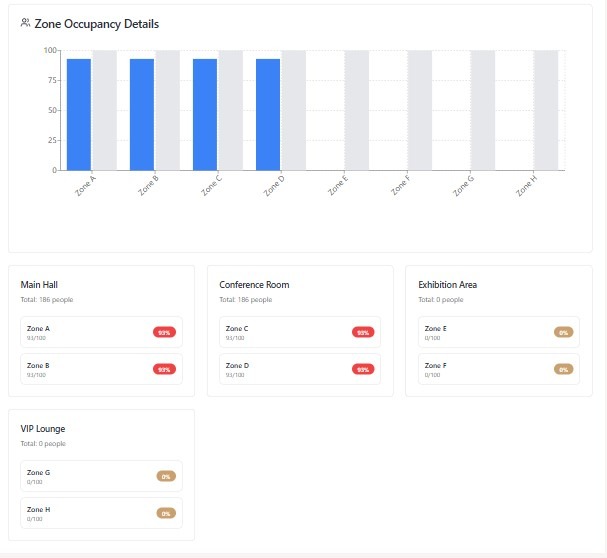
Live Zone Occupancy
See current headcount in every zone, updated with every scan. Capacity percentage bars give instant visual status.
Registration Funnel
Track registrations from submitted → approved → badged → checked-in for every attendee category in real time.
Approval Queue Monitor
Visibility into pending approvals across all approvers — surface bottlenecks before they become delays.
Anomaly Alerts
Automated alerts for unusual scan patterns: unusually high denial rates, rapid badge reuse, or scanner offline events.
Historical Benchmarking
Compare current event metrics against previous events to identify improvements and regressions.
Automated Reports
Post-event PDF and Excel reports generated automatically with executive summaries, charts, and raw data exports.
Who Uses This Service?
Our real-time analytics capability is deployed across a wide range of event types and industries.
Industries using this service:
Used across
6 Event Types
Zone-Based Access Control
Enforce multi-layered security across every checkpoint — in real time.
View Service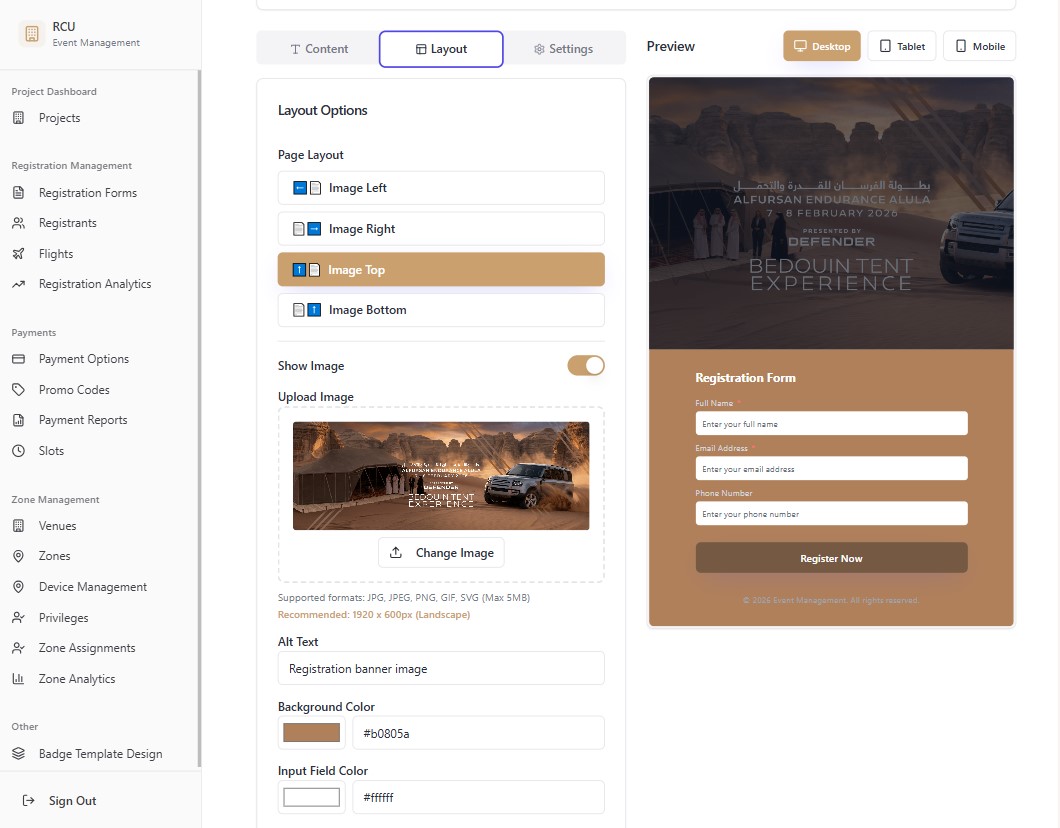
Self-Registration Portal
Let attendees register themselves — accurately and instantly — from anywhere.
View Service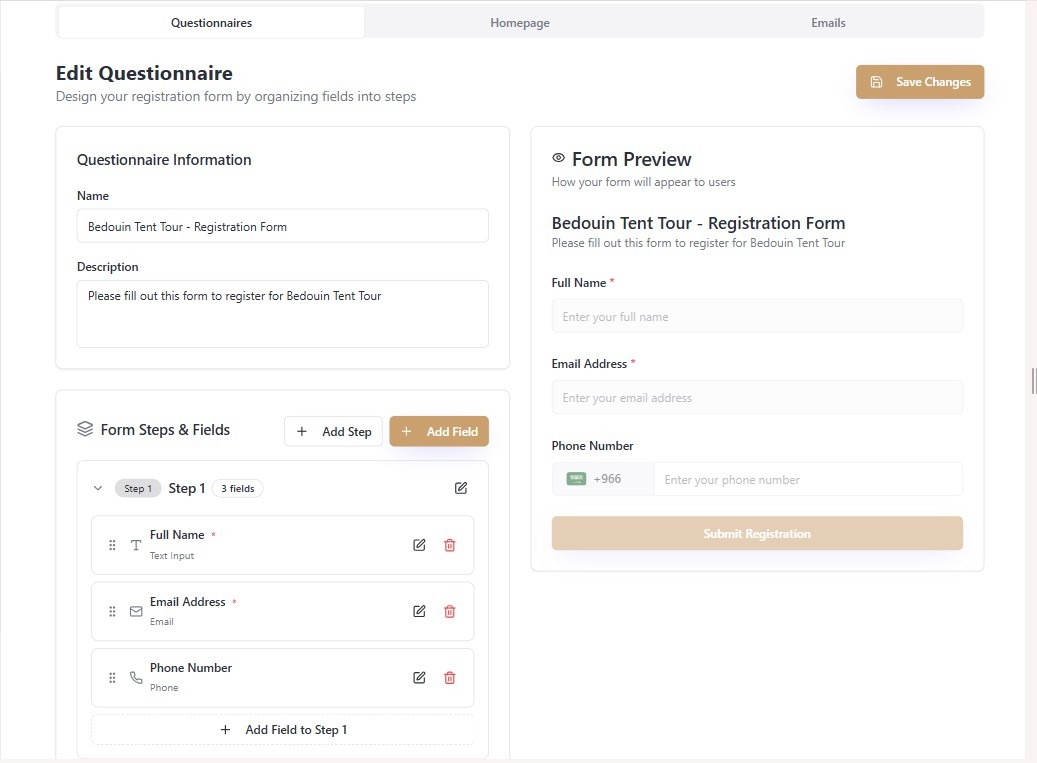
Dynamic Questionnaires
Collect the exact data each zone and attendee type requires — without writing a line of code.
View Service